Frequency Ratio--Based GIS Analysis of Landslide Susceptibility in Udhampur District, Western Himalayas
Abstract
Landslides are recurrent and destructive geohazards in the Himalayan foothills, where steep slopes, complex geology, intense rainfall, and rapid land-use changes exacerbate slope instability. This study presents a landslide susceptibility assessment for Udhampur District, Jammu and Kashmir, India, integrating multi-source geospatial datasets within a GIS-Python framework. Nine causative factors---elevation, slope, aspect, distance to roads, streams, and faults, precipitation, NDVI, and land use/land cover (LULC)---were analyzed using the Modified Frequency Ratio (MFR) method. Annual rainfall data spanning 2014--2024 from the CHRS-UCI database, along with Landsat-8-derived NDVI and LULC (2024), were harmonized with DEM-based topographic and infrastructural variables. The MFR model enabled continuous, normalized estimation of each factor's contribution to slope failure, reducing class subjectivity and improving spatial precision. Model validation using Receiver Operating Characteristic (ROC) analysis yielded a moderate Area Under the Curve (AUC = 0.67), confirming reliable predictive performance. The resulting susceptibility map, classified into very low to very high zones, indicates that steep slopes, high rainfall areas, sparsely vegetated regions, and locations near roads and faults are particularly vulnerable. The study provides actionable insights for targeted disaster mitigation, emphasizing slope stabilization, afforestation, and regulated development in high-risk areas. While certain micro-topographic, soil, and temporal variations remain unaccounted for, the integrated GIS-Python approach offers a replicable framework for landslide risk assessment in the western Himalayas, supporting proactive planning and hazard reduction strategies.
Keywords
Landslide Susceptibility; Modified Frequency Ratio (MFR); GIS; Remote Sensing; Rainfall Variability; NDVI; Land Use/Land Cover (LULC); Udhampur District; ROC-AUC; Slope Stability
1. Introduction
Landslides are among the most destructive natural hazards worldwide, causing significant loss of life, economic damage, and disruption to infrastructure. They occur when gravitational forces acting on a slope exceed the shear strength of soil or rock, often triggered by heavy rainfall, seismic activity, snowmelt, or anthropogenic activities such as deforestation and construction (Highland & Bobrowsky, 2008; Guzzetti et al., 2005). Mountainous regions---including the European Alps, the Andes, and the Japanese and Taiwanese ranges---are particularly prone to landslides due to steep slopes, complex lithology, and dynamic tectonics (Sidle & Ochiai, 2006; Rossi et al., 2021). Typhoon- and monsoon-induced landslides in these regions demonstrate the vulnerability of settlements and transportation networks to intense rainfall and steep terrain.
In South Asia, and particularly the Himalayas, landslides are frequent due to the combination of steep slopes, fragile geology, intense monsoonal rainfall, and growing anthropogenic pressures (Kirschbaum et al., 2015; Petley, 2012). The Himalayas' heterogeneous lithology, high seismicity, and dynamic tectonics contribute to widespread slope instability, while rapid urbanization and land-use changes exacerbate risks (Singh et al., 2022; Bhat et al., 2019). Studies across the region have highlighted rainfall patterns, slope gradient, aspect, and human activity as key controls on landslide occurrence, underlining the need for detailed, high-resolution hazard assessments (Chowdhury & Shahid, 2021; Bhardwaj et al., 2023).
Within the Indian Himalayas, Jammu and Kashmir exhibits notable landslide activity, particularly along steep valleys and critical road corridors. Udhampur District, located in the Jammu region, is characterized by rugged terrain, narrow ridges, and elevations ranging from 600 to over 2,500 m above mean sea level. The district's topography, diverse lithology, seismic activity, and monsoonal rainfall make it highly susceptible to slope failures. Recent events, including landslides in Balli Nullah and Omara village, caused property damage, transportation disruptions, and threats to public safety (Free Press Journal, 2025; Daily Excelsior, 2025). Such events highlight the pressing need for robust landslide susceptibility assessments.
Landslide occurrence is influenced by a complex interplay of natural and anthropogenic factors. Climatic triggers, particularly intense rainfall, increase pore water pressure and reduce soil shear strength. Topographic factors, including slope, elevation, and aspect, affect gravitational forces, soil moisture distribution, and vegetation growth, impacting slope stability (Papathanassiou et al., 2013; Liu et al., 2021). Proximity to rivers and streams accelerates erosion and undercutting, while human activities such as road construction, deforestation, and agriculture further destabilize slopes (Guzzetti et al., 2012; Dhakal et al., 2020). Lithology influences soil cohesion and erodibility, affecting landslide susceptibility (Ghosh et al., 2020). Vegetation, quantified using NDVI, reinforces slopes, while land use and land cover reflect human intervention and surface disturbance (Carrara et al., 1991; Zhou et al., 2021).
In this study, nine key factors---elevation, slope, aspect, distance to faults, rivers, and roads, rainfall, NDVI, and LULC---were selected to assess landslide susceptibility in Udhampur. Lithology was also considered qualitatively to contextualize slope vulnerability. By integrating these factors in a GIS-Python workflow and applying the Modified Frequency Ratio (MFR) model, this study aims to:
-
Quantify the relative influence of each causative factor on landslide occurrence.
-
Produce a high-resolution landslide susceptibility map for Udhampur District.
-
Provide actionable insights for targeted disaster mitigation, land-use planning, and slope management.
This integrated approach addresses gaps in district-level susceptibility assessments in the western Himalayas and supports evidence-based hazard reduction strategies, balancing technical rigor with practical applicability.
2. Study Area
The study area for this research is Udhampur district, located in the Jammu region of the Union Territory of Jammu and Kashmir, India. The district lies between 32°34′--33°04′N latitude and 75°03′--76°18′E longitude, covering a total area of approximately 2,380 km² udhampur.nic.in. Udhampur is characterized by a rugged and hilly terrain, with elevations ranging from 600 m to over 2,500 m above mean sea level, forming part of the Outer Lesser Himalayas. The district exhibits steep slopes, deep valleys, and narrow ridges, creating a complex geomorphological setting that is highly susceptible to slope instability and landslides.
The geological composition of the area is diverse, consisting primarily of metamorphic rocks such as schists, gneisses, and quartzites, interspersed with granitic intrusions. Lithological heterogeneity, combined with structural weaknesses such as faults and joints, significantly influences slope stability and landslide susceptibility. Additionally, the region is seismically active, lying close to seismic zone IV as per the Indian seismic zoning map, which further increases the risk of slope failures during earthquake events.
Climatically, Udhampur experiences a subtropical humid climate, with hot summers and cold winters. The district receives an average annual rainfall of approximately 1,400--1,600 mm, mostly concentrated during the monsoon months of June to September. Intense rainfall events during the monsoon season often act as triggers for both shallow and deep-seated landslides, causing significant damage to infrastructure, agricultural land, and human settlements.
Udhampur's socio-economic profile is predominantly rural, with agriculture, horticulture, and forestry forming the backbone of the local economy. The expansion of road networks, construction activities, and urban settlements on steep slopes has exacerbated slope instability, particularly in areas with loose soil and deforested hillsides. According to local disaster management reports, the combination of anthropogenic activities and natural triggers has resulted in numerous small- to medium-sized landslides scattered throughout the district.
For the purpose of this study, eleven key causative factors for landslides were identified, based on prior research and their known influence on slope stability. These factors include elevation, slope, slope aspect, lithology, distance from faults, distance from rivers, distance from roads, rainfall, Normalized Difference Vegetation Index (NDVI), and land use/land cover. Each factor was extracted from high-resolution spatial datasets and processed using ArcGIS and Python to ensure accuracy in spatial analysis. The historical landslide inventory for Udhampur was compiled from field surveys, satellite imagery, and local reports, providing a reliable basis for landslide susceptibility modeling.
The unique combination of rugged terrain, lithological diversity, intense rainfall, and anthropogenic disturbances makes Udhampur an ideal study area for landslide risk evaluation. Despite the frequent occurrence of landslides in the district, quantitative assessments of landslide susceptibility remain limited. This study addresses this gap by employing a modified Frequency Ratio (FR) approach to produce a comprehensive landslide susceptibility map, which can inform disaster management strategies, urban planning, and land-use policy within the district.
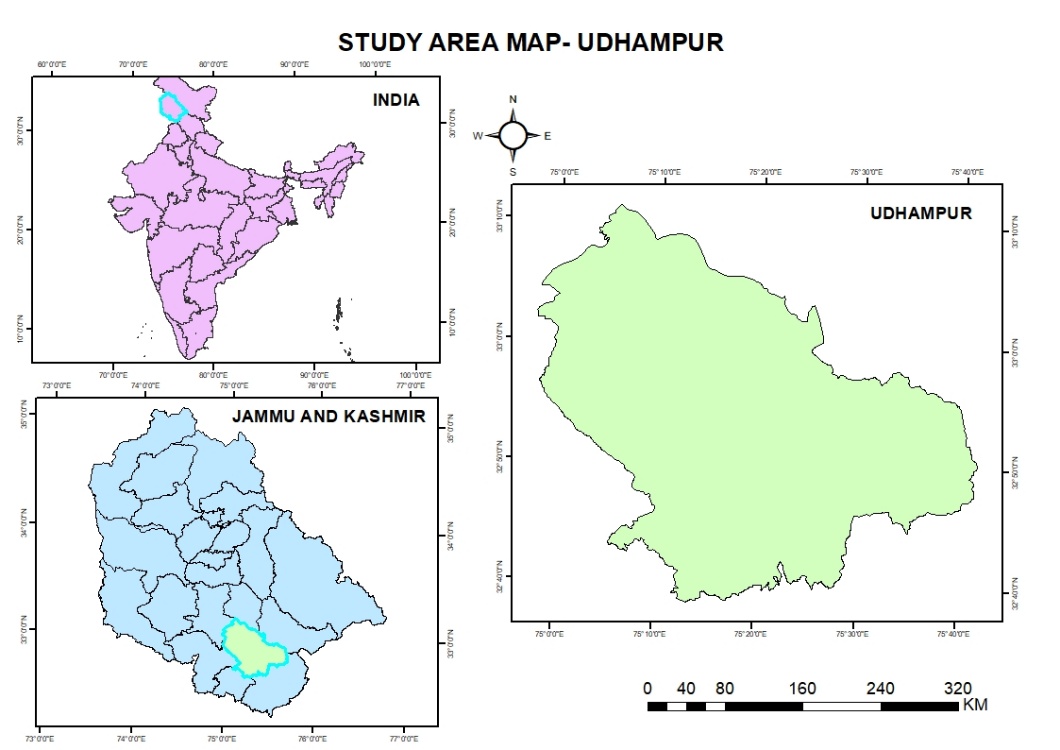
Figure 1. Location of Udhampur District, Jammu & Kashmir, India.
3. Literature Review
3.1 Climate Change, Rainfall Variability, and Landslide Susceptibility: Global to Regional Perspectives/ Global climate change has significantly altered precipitation patterns, increasing both the frequency and intensity of extreme rainfall events. The Intergovernmental Panel on Climate Change (IPCC, 2021) reports that heavy rainfall events are becoming more frequent, triggering a wide range of hydrological hazards, including landslides. In mountainous regions, where steep slopes and fragile terrain prevail, intense rainfall rapidly increases pore water pressure, reduces slope stability, and can initiate catastrophic mass movements (Fan et al., 2020; Petley et al., 2018). Numerous international examples highlight rainfall-induced landslides: typhoon-triggered failures in Taiwan and Japan (Sidle & Ochiai, 2006), prolonged rainfall-induced events in the European Alps and Apennines (Guzzetti et al., 1999; Rossi et al., 2021), and large-scale landslides along Andean mountain corridors in Colombia and Peru (Restrepo et al., 2009; Villacres et al., 2022).
In South Asia, rainfall extremes have intensified in recent decades. Studies in India indicate a decline in moderate rainfall events and an increase in high-intensity rainfall episodes concentrated over shorter periods (Mondal & Mujumdar, 2015; Chowdhury & Shahid, 2021). Such extremes amplify landslide susceptibility, particularly when they coincide with steep slopes, riverine erosion, and anthropogenic disturbances. Recent assessments demonstrate that rainfall variability interacts synergistically with topography and land use, leading to a higher frequency of slope failures and more severe downstream impacts (Singh et al., 2022; Bhardwaj et al., 2023). These findings highlight the importance of integrating rainfall patterns in landslide susceptibility studies across both global and regional scales.
3.2 Topographic Controls: Slope, Elevation, and Aspect/ Topography is a fundamental determinant of landslide occurrence. Slope angle directly influences the gravitational forces acting on a soil or rock mass, with steeper slopes generally exhibiting higher susceptibility to failure (Papathanassiou et al., 2013). Elevation affects microclimatic conditions, vegetation distribution, and precipitation intensity, indirectly influencing landslide frequency (Liu et al., 2021).
Slope aspect controls exposure to sunlight and moisture retention, which affect vegetation growth, soil drying rates, and seasonal rainfall runoff. In the Himalayas, north- and south-facing slopes often display differential stability due to these microclimatic variations (Magliulo et al., 2008; Saha et al., 2005). GIS-based studies emphasize the importance of integrating slope, elevation, and aspect in landslide susceptibility models, as these factors collectively improve predictive accuracy (Sharma et al., 2022; Bhardwaj et al., 2023).
3.3 Hydrological Factors: Rainfall and Distance to Streams/ Rainfall is the principal trigger of landslides in the Himalayas, enhancing pore water pressure and reducing the shear strength of slope materials (Hong et al., 2018). High-intensity rainfall events, whether monsoonal or short-duration cloudbursts, can rapidly induce slope failures. Annual rainfall and decadal mean rainfall surfaces derived from CHRS (University of California, Irvine) and other high-resolution remote sensing datasets are increasingly used for landslide hazard mapping (Fayech & Tarhouni, 2020; Liu et al., 2021).
Proximity to streams and rivers further amplifies landslide risk. Stream erosion undercuts slopes, destabilizes soils, and increases the likelihood of mass wasting events (Hong et al., 2018; Villacres et al., 2022). Incorporating Euclidean distance from streams into GIS-based susceptibility models has proven critical for accurately delineating hazard zones in Himalayan valleys (Dhakal et al., 2020). Together, rainfall and drainage proximity provide a comprehensive understanding of hydrological triggers.
3.4 Anthropogenic Factors: Roads and Land Use/ Human interventions, such as road construction and settlements, are significant anthropogenic triggers for landslides. Mountain road networks, particularly unplanned or poorly engineered roads, disturb slope integrity, expose cut slopes, and create artificial drainage paths that facilitate mass movement (Guzzetti et al., 2012; Dhakal et al., 2020). Proximity to roads is therefore a key factor in landslide susceptibility modeling and is increasingly incorporated using GIS-based Euclidean distance calculations.
Land-use changes, including deforestation, urban expansion, and agriculture, also strongly influence slope stability. Landslide susceptibility models incorporating LULC and NDVI allow assessment of vegetation cover and human-induced surface disturbance (Carrara et al., 1991; Akgun et al., 2020; Sharma et al., 2022). NDVI, derived from Landsat-8 bands 4 and 5, provides quantitative insights into vegetation density, which enhances slope stability through root reinforcement and soil consolidation (Zhou et al., 2021).
3.5 Tectonic Factors: Distance to Fault/ Active faults are zones of structural weakness that influence slope stability by creating fractured rock masses and preferential pathways for water infiltration. Slopes near faults are prone to sudden failure due to reduced cohesion and increased water penetration (Ferentinos et al., 1988; Wang et al., 2020). Incorporating fault data from the Geological Survey of India into GIS-based susceptibility analyses enables more precise hazard zoning in tectonically active regions, including the western Himalayas.
3.6 Case Studies of Factor-Driven Landslides in the Himalayas/ Himalayan landslides often result from interactions among climatic, topographic, hydrological, and anthropogenic factors. The 2013 Kedarnath disaster in Uttarakhand, triggered by extreme rainfall, demonstrates the synergistic role of steep slopes, heavy precipitation, and human interventions along valley slopes (Bhambri et al., 2016). In Himachal Pradesh, landslides along the Kullu--Manali highway are consistently linked to road construction and stream proximity (Thakur & Singh, 2018).
In Jammu and Kashmir, rainfall-triggered landslides along the Jammu--Srinagar National Highway highlight the importance of incorporating roads, NDVI, LULC, and proximity to streams and faults in hazard assessments (Bhat et al., 2019; Singh et al., 2022). Udhampur district, characterized by steep slopes, complex drainage networks, and active tectonics, experienced significant landslide activity in 2025, causing property damage and casualties. Despite the recurrence of such events, high-resolution, district-level susceptibility maps integrating rainfall, topography, vegetation, and anthropogenic factors remain limited.
The present study addresses this gap by leveraging NASA's Global Landslide Hazard Database, CHRS rainfall datasets, GSI fault maps, open-source road and stream data, Landsat-8-derived NDVI, and LULC products. By applying a modified frequency ratio (MFR) method in ArcGIS, complemented with Python-based AUC optimization, the study robustly quantifies factor contributions and generates precise landslide risk maps. This approach advances current Himalayan susceptibility assessments by integrating multiple factors within a data-driven, GIS-based framework, providing actionable insights for disaster management and land-use planning.
4. Materials and Methods
4.1 Data Collection and Preparation
A comprehensive spatial database was developed to support landslide susceptibility assessment in Udhampur District, Jammu and Kashmir. All spatial analyses were conducted in ArcGIS 10.8, ensuring consistent resolution, projection, and spatial alignment across datasets. The database integrated landslide inventory records, DEM-derived parameters, precipitation, fault lines, roads, streams, NDVI, and Land Use/Land Cover (LULC) data.
Raster datasets (DEM, precipitation, NDVI, and LULC) were resampled to a uniform spatial resolution of 30 m to enable pixel-level consistency. Vector datasets (faults, roads, streams) were projected to the same coordinate system and clipped to the study boundary. When necessary, vector layers were converted to raster format to facilitate overlay and statistical analyses.
Data processing steps included:
-
DEM Derivatives: Slope, aspect, and elevation layers were generated from the 30 m SRTM DEM using ArcGIS Spatial Analyst tools. Slope was expressed in degrees, while aspect captured directional orientation.
-
Distance Layers: Euclidean distance rasters were computed for roads, streams, and faults to quantify anthropogenic and structural influences.
-
NDVI Computation: NDVI was derived from Landsat-8 OLI imagery using bands 5 (NIR) and 4 (Red):
$$/text{NDVI} = /frac{/text{NIR} - /text{Red}}{/text{NIR} + /text{Red}}$$
This layer reflects 2024 vegetation cover conditions, providing a measure of slope stabilization through vegetation density.
-
LULC Extraction: A 2024 Land Use/Land Cover map was obtained from Landsat-8 imagery, classifying the region into urban, agricultural, forest, barren, and water categories, reflecting contemporary land cover influences.
-
Precipitation Data: Annual rainfall data (2014--2024) were obtained from the Center for Hydrometeorology and Remote Sensing (CHRS), University of California, Irvine. Individual annual rainfall maps were generated and averaged to produce a decadal mean rainfall surface for spatial analysis.
Dataset Source Type Year / Purpose Period
Landslide NASA Global Vector 2014--2024 Model Inventory Landslide Hazard calibration & Database validation
  DEM          SRTM (USGS)       Raster        2024      Slope, aspect,
                                                           elevation
                                                           extraction
Precipitation CHRS, Univ. of Raster 2014--2024 Rainfall factor California, analysis Irvine
Fault Lines Bhukosh -- GSI Vector 2024 Structural influence on slopes
 Roads        OpenStreetMap      Vector        2024      Anthropogenic
                                                          disturbance

Streams       OpenStreetMap      Vector        2024     Fluvial erosion
                                                            mapping

 NDVI       Landsat-8 (Bands     Raster        2024        Vegetation
                 4 & 5)                                 density analysis

 LULC           Landsat-8        Raster        2024     Land-use impact
               (Supervised                                 assessment
             Classification)
Lithology/* Geological Survey Vector 2024 Geological of India context
Table 1. Data sources and descriptions used for landslide susceptibility analysis in Udhampur district.
4.2 Landslide Inventory
Historical landslide data served as the dependent variable and were used to calibrate and validate the landslide susceptibility model. The dataset, obtained from NASA's Global Landslide Hazard Database, represents generalized landslide-prone zones rather than individual events. Each feature was converted to raster format to facilitate overlay with the Modified Frequency Ratio (MFR) model. This inventory captures recurring spatial patterns of landslide occurrence across Udhampur District.
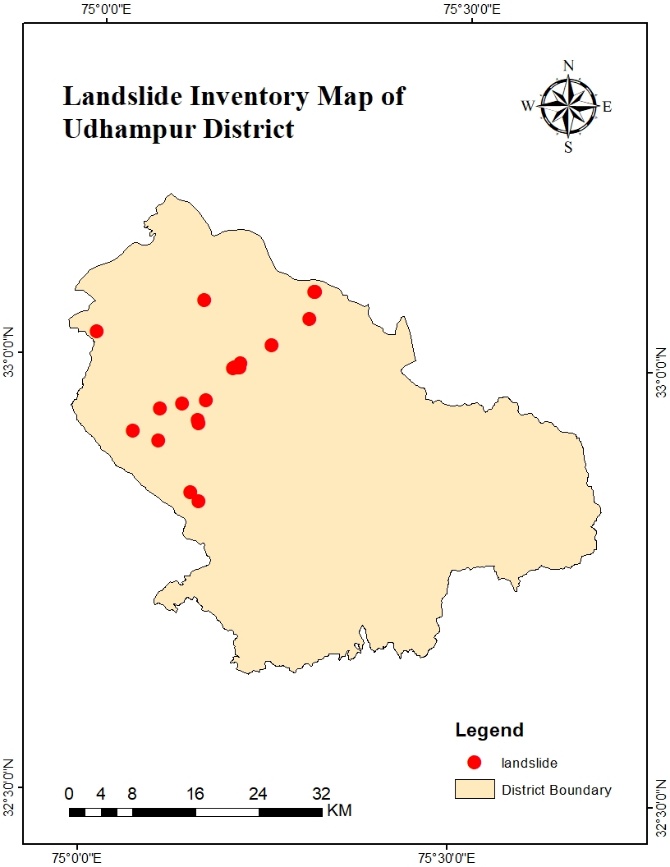
Figure 2. Landslide inventory map of Udhampur District showing areas most commonly affected by slope failures, derived from NASA's Global Landslide Hazard Database.
4.3 Landslide Causative Factors
Based on literature review, local geomorphology, and data availability, nine key factors were selected for landslide susceptibility assessment:
-
Elevation: Higher elevations correlate with steeper slopes, thinner soils, and increased precipitation.
-
Slope: Represents terrain steepness; steeper slopes exert greater gravitational forces.
-
Slope Aspect: Influences solar radiation, soil moisture, and microclimate.
-
Distance from Faults: Fault zones are structural weak points, increasing instability.
-
Precipitation: Annual rainfall (2014--2024) increases pore water pressure and reduces soil shear strength.
-
Distance from Streams: Proximity to watercourses promotes erosion and slope undercutting.
-
NDVI: Vegetation stabilizes slopes by anchoring soil and reducing runoff.
-
Distance from Roads: Anthropogenic activities can destabilize slopes.
-
Land Use/Land Cover (LULC): Urbanization, agriculture, and forests influence soil compaction, vegetation, and drainage.
All factors were processed into continuous 30 m raster layers, ensuring compatibility for overlay analyses and MFR modeling.
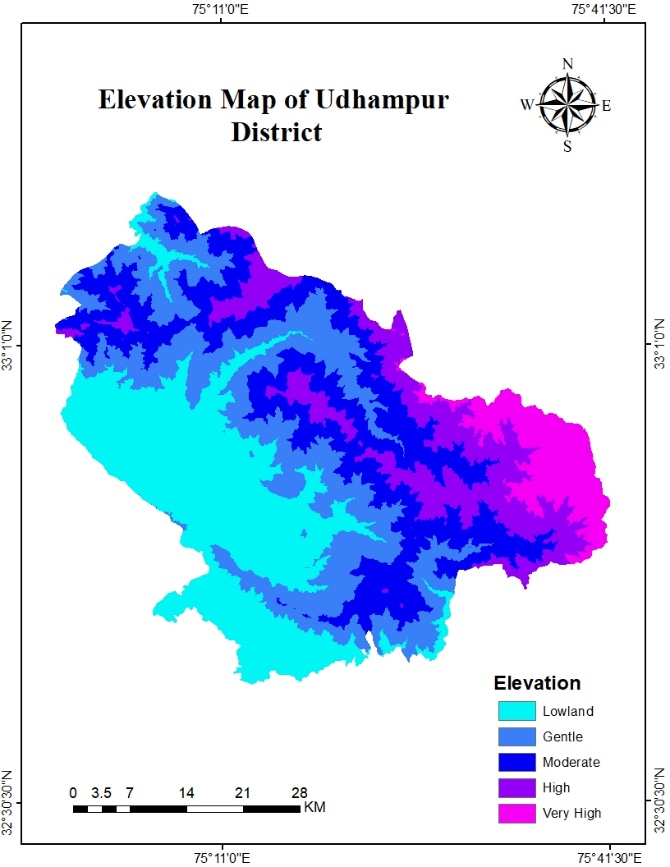
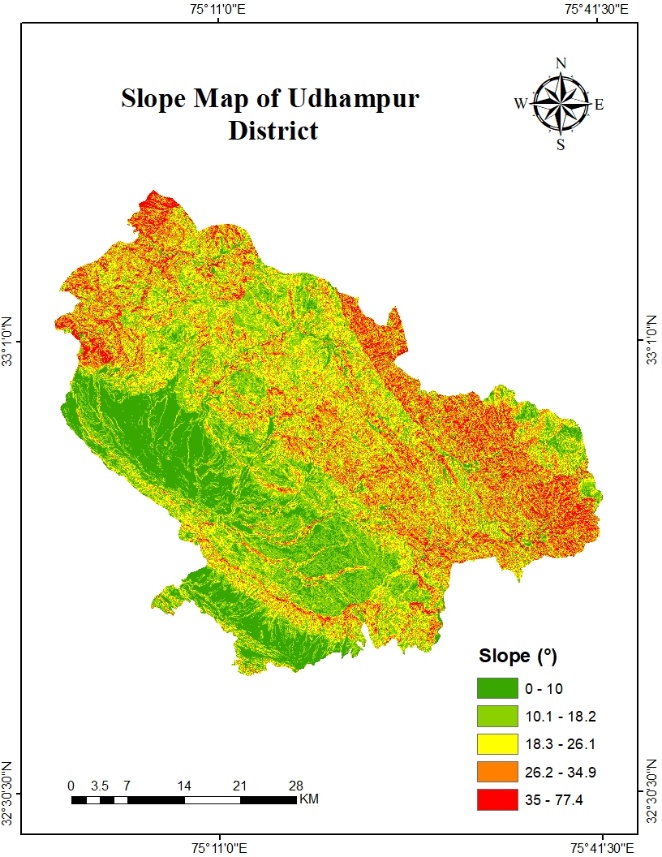
Figures 3--4. Elevation and slope maps of Udhampur District derived from 30 m SRTM DEM. The maps depict the spatial variability of terrain, with steep slopes and high elevations concentrated in the northern and eastern regions, highlighting areas with increased susceptibility to landslides.
{width="2.8585137795275593in" height="3.6993471128608926in"}
{width="2.8901443569553806in" height="3.7402777777777776in"}
{width="2.819220253718285in" height="3.648494094488189in"}
{width="2.8081671041119862in" height="3.6341885389326336in"}
Figures 5--8. Spatial distribution of landslide causative factors in Udhampur District: slope aspect (Fig. 5), distance from faults (Fig. 6), annual rainfall (Fig. 7), and distance from streams (Fig. 8). The maps illustrate topographic orientation, structural weaknesses, precipitation patterns, and hydrological influences that collectively affect slope stability and landslide susceptibility.
{width="2.8661253280839896in" height="3.7091983814523184in"}
{width="2.8520417760279964in" height="3.6909722222222223in"}
{width="3.12711832895888in" height="4.046961942257218in"}
Figures 9--11. Spatial distribution of additional landslide causative factors in Udhampur District: NDVI (Fig. 9), distance from roads (Fig. 10), and land use/land cover (LULC, Fig. 11). The maps highlight vegetation density, anthropogenic disturbance, and land cover patterns, which influence slope stability and the likelihood of landslide occurrences.
Lithology/ The geological composition of Udhampur District is diverse, comprising metamorphic rocks such as schists, gneisses, and quartzites, interspersed with granitic intrusions. Lithology influences slope stability by affecting soil cohesion, permeability, and susceptibility to erosion. Although lithological information was not incorporated into the Modified Frequency Ratio (MFR) analysis due to data resolution limitations, it was included as contextual information to aid the interpretation of landslide susceptibility patterns.
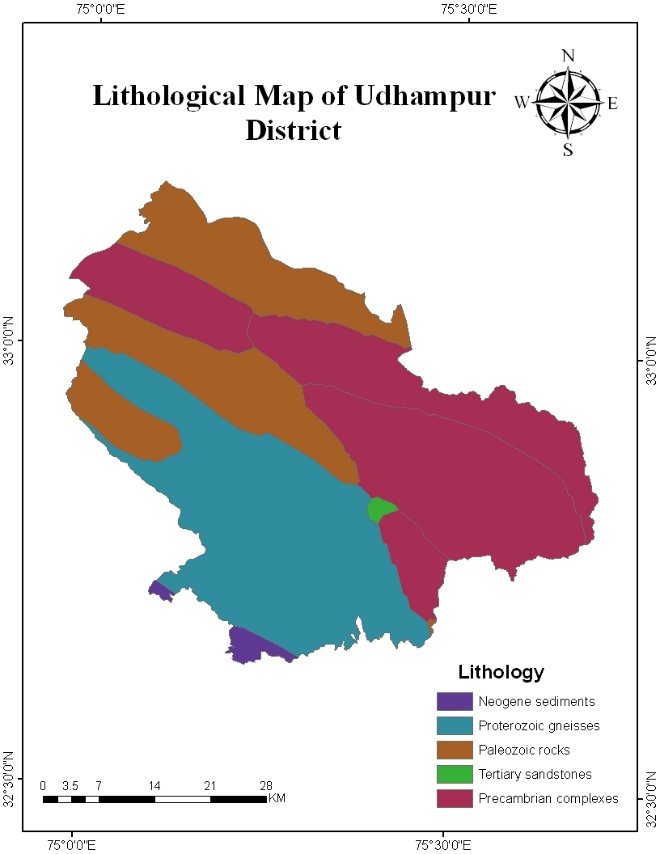
Figure 12. Lithological distribution of Udhampur District. While not directly used in statistical modeling, this map provides geological context, helping to explain variations in slope stability and landslide susceptibility across the region.
4.4 Modified Frequency Ratio (MFR) Method
The MFR method quantifies the relative contribution of each causative factor to landslide occurrence. Unlike conventional FR, MFR uses normalized continuous values to improve spatial resolution and reduce subjective binning.
$$FR(x_{i}) = /frac{P(/text{landslide} /mid x_{i})}{P(/text{landslide})}$$
The Landslide Susceptibility Index (LSI) is the sum of FR values across all factors:
$$LSI = /sum_{i = 1}^{n}{}FR(x_{i})$$
The resulting continuous LSI surface allows high-resolution susceptibility mapping, where higher values indicate greater likelihood of slope failure.
4.5 Python Integration and AUC Optimization
Python scripting automated the workflow:
-
Raster normalization
-
FR computation
-
Optimal bin width selection for continuous variables
-
ROC and AUC analysis for model validation
The Python-GIS integration ensured reproducible, precise calculations and enhanced predictive reliability.
4. Results
4.1 Causative Factor Analysis
The nine selected causative factors were analyzed using the Modified Frequency Ratio (MFR) method to quantify their influence on landslide occurrence in Udhampur District. The frequency ratio (FR) values, presented in Table 2 and visualized in Figure 13, indicate the relative contribution of each factor to slope instability.
Analysis reveals that rainfall is the primary triggering factor, with an FR value of 1.41. This highlights that areas experiencing higher annual precipitation between 2014 and 2024 are significantly more susceptible to landslides. Elevation (FR = 1.21) and proximity to faults (FR = 1.20) also play a strong role, reflecting the combined influence of topography and structural weaknesses typical of Himalayan terrains.
Moderate contributions are observed from land use/land cover (FR = 1.17), slope (FR = 1.16), NDVI (FR = 1.16), and slope aspect (FR = 1.12). These factors demonstrate the stabilizing or destabilizing effects of vegetation cover, human activity, and micro-topographic orientation. Distance to roads (FR = 1.12) and distance to rivers (FR = 1.08) exert a lower influence overall but remain locally significant, particularly near infrastructural corridors and erosive channels.
Factor FR Value
Slope 1.16
Aspect 1.12
Elevation 1.21
NDVI 1.16
LULC 1.17
Distance to 1.12 Road
Distance to 1.08 River
Distance to 1.2 Fault
Rainfall 1.41
Table 2: Frequency ratio (FR) values for landslide causative factors in Udhampur.I think it will be number
Figure 13. Relative contribution of landslide causative factors in Udhampur District, emphasizing the predominance of rainfall and the moderate influence of elevation, faults, and land use, with secondary effects from distance to rivers and roads.
The graph illustrates that rainfall is the dominant factor, while elevation, faults, and land use exert moderate influence. Distance to rivers and roads, though less impactful overall, remains important in localized areas. This quantitative assessment enables prioritization of critical zones for landslide mitigation and management.
Model Performance/ The predictive performance of the landslide susceptibility model was evaluated using the Area Under the Curve (AUC) of the Receiver Operating Characteristic (ROC). The model achieved an AUC of 0.66996, indicating moderate predictive capability. Python scripting automated raster normalization, FR computation, and bin-width optimization, ensuring reproducibility and precision in calculations. This continuous 30 m resolution workflow effectively integrates the combined influence of all nine causative factors.
4.2 Landslide Susceptibility Map
The Landslide Susceptibility Index (LSI) was computed by summing the FR values across all causative factors. The resulting continuous map was classified into five categories: very low, low, medium, high, and very high susceptibility (Figure 14).
Spatial patterns reveal that:
-
High and very high-risk zones are concentrated on steep slopes, near fault lines, and in sparsely vegetated areas.
-
Medium-risk zones occur on moderately steep slopes with mixed land cover.
-
Low and very low-risk zones are predominantly flatter terrain or densely vegetated areas, where natural stabilization reduces susceptibility.
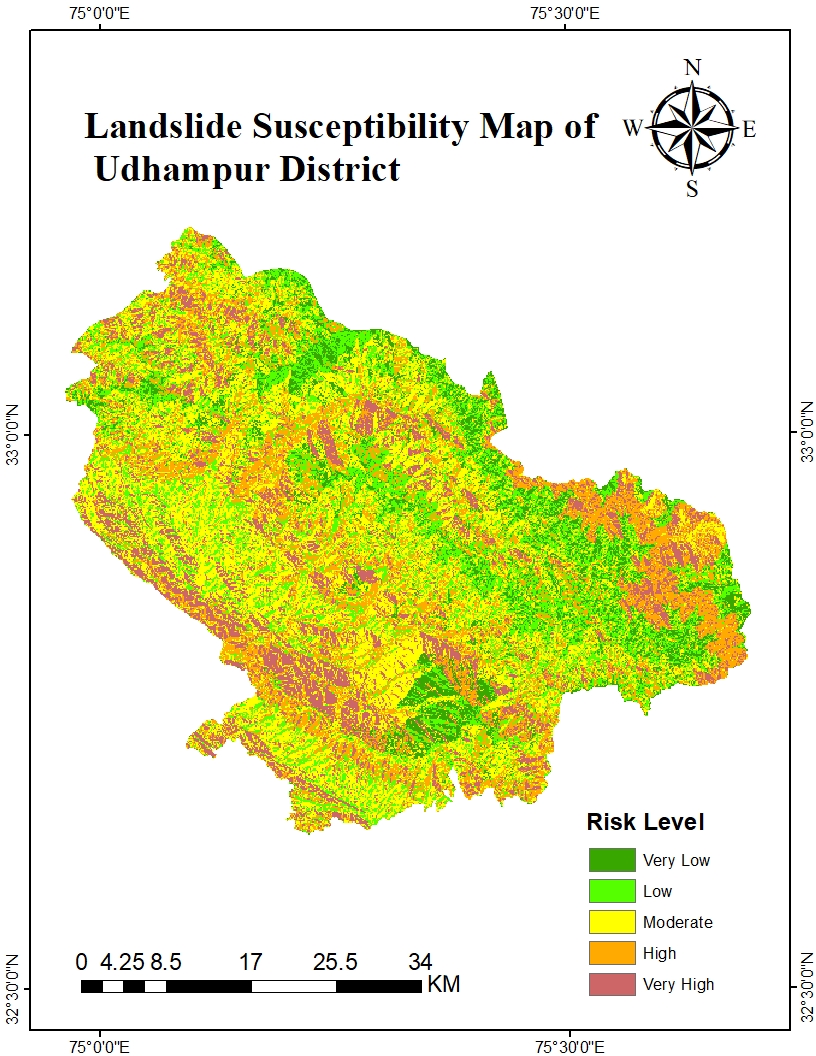
Figure 14. Landslide susceptibility map of Udhampur District, classified into five risk categories, highlighting high to very high-risk areas for targeted hazard management and planning.
This susceptibility map provides actionable insights for disaster management, including identifying vulnerable regions, prioritizing high-risk zones, and supporting informed planning and mitigation strategies.